Dashboards
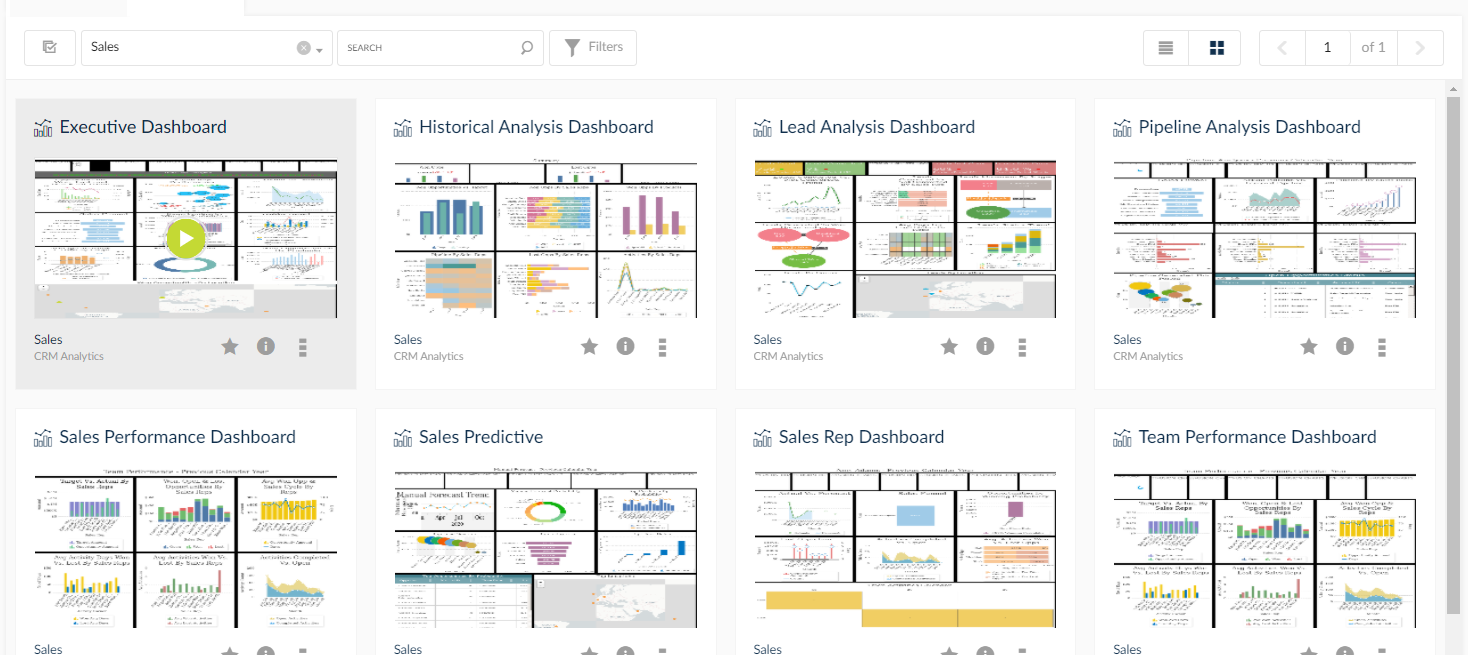
Dashboards are a collection of charts designed to visualize a variety of data in one general area. SplashBI offers you the ability to create interactive dashboards that can be used to provide insight into various areas of interest. Dashboards are easy to create and modify, drill-downs into data behind the charts, and can even be shared with others.
Added background color of Dashboard Tabs in Dashboard Thumbnails
Dashboard Thumbnails should get background color of tabs. User can use default color or select specific colors for tabs.
In this section you will learn about:
- Dashboard View Options
- Create/Edit Dashboard
- Run Dashboard
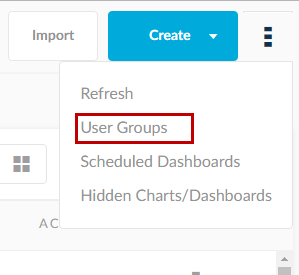
- Navigate to User Group page by clicking the User Group icon.
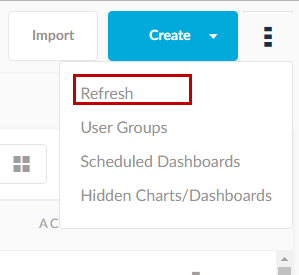
- Refresh the entire dashboard list page by clicking Refresh icon.