Drilldown Charts
Drilldown functionality will direct you from one location to another, from information to detailed data concerning a specific data set. Drilldown allows access to the top end data displayed in the chart.
For example, in a chart displaying total revenue for a specific time period, broken down by product type or sales representatives, the Drilldown function allows you to click on a specific portion of the data to view information based on that specific portion. Drilldown supports n-level. If you did not configure any drill down, by default auto drill will be triggered in a table format.
NOTE: The Drilldown function is only a live function and will be active once the charts are installed into a dashboard.
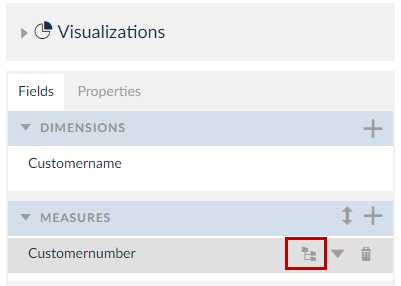
You can configure the drill down from the entry in the measures tab by clicking the drill icon. For more information, check Drilldown Configurations.

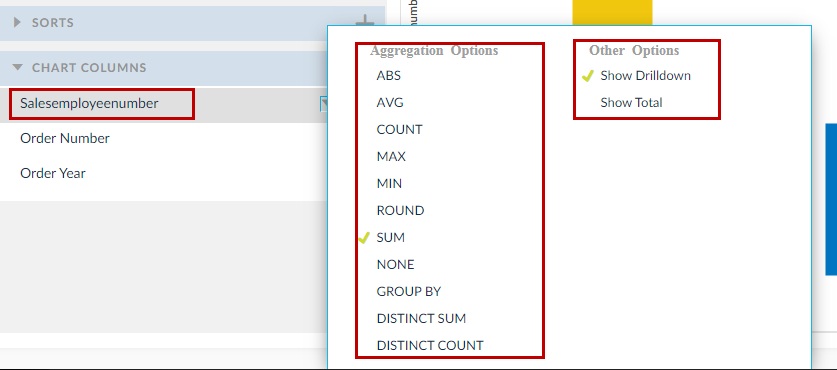
The drilldown columns are displayed under the Chart Columns panel. You can click the column and choose to display the aggregation, drilldown and total.

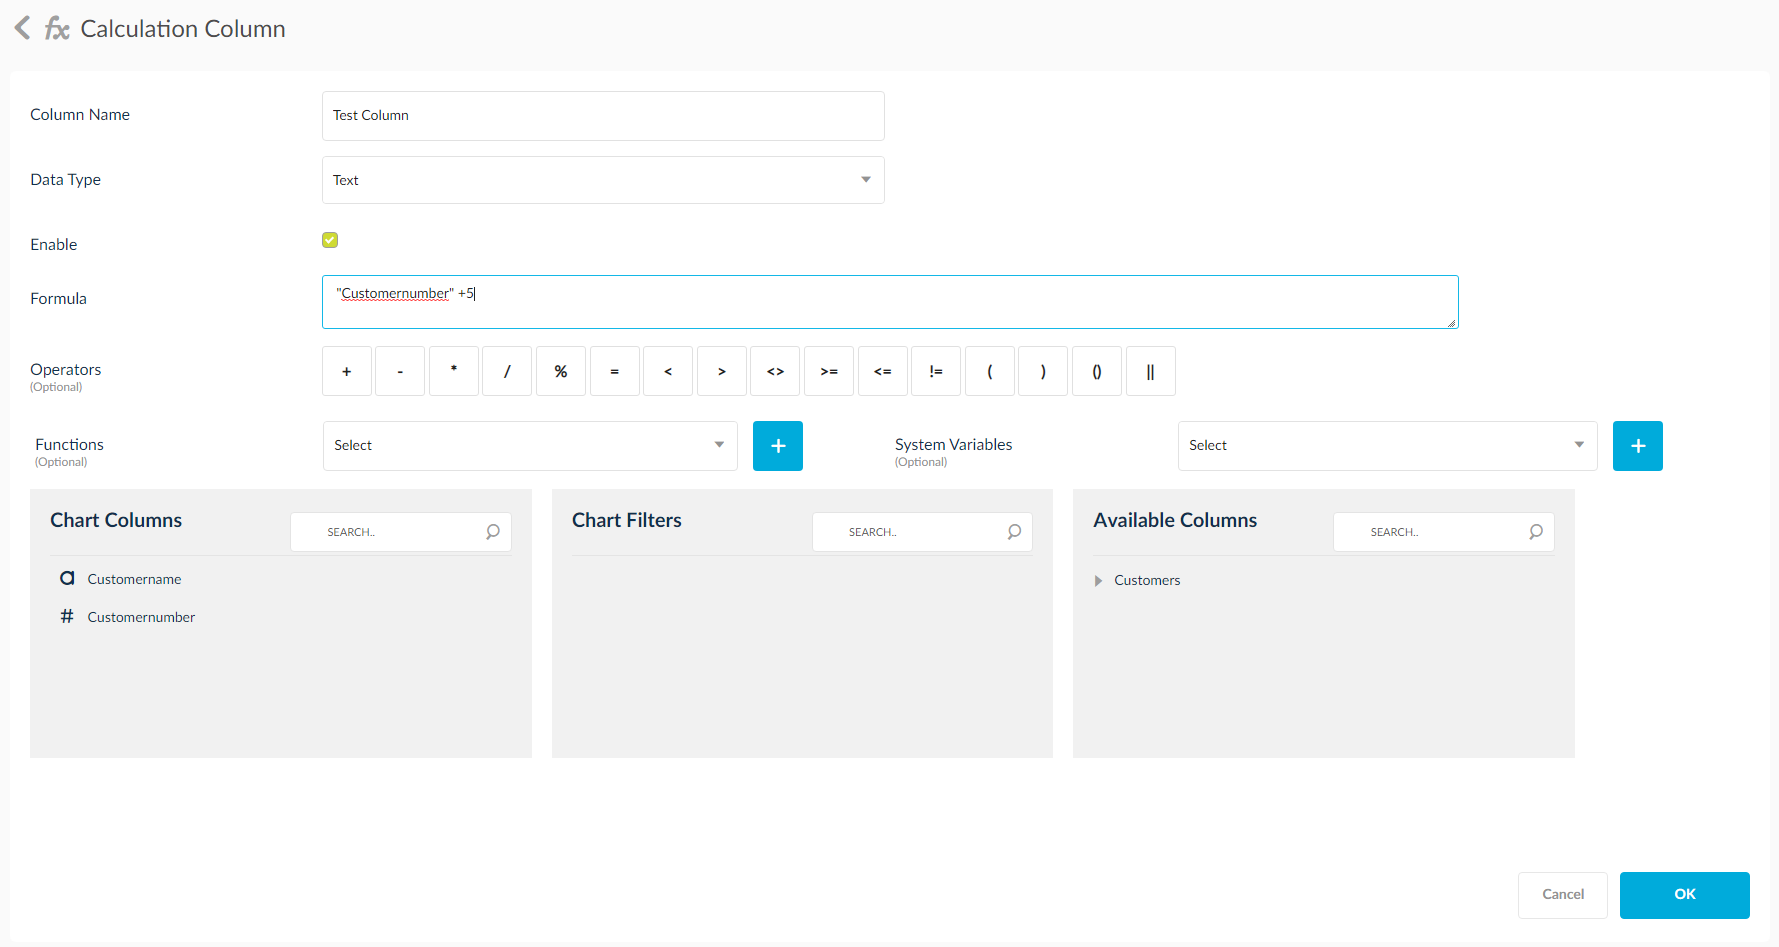
Click the ![]() icon to make drill columns as calculation columns.
icon to make drill columns as calculation columns.

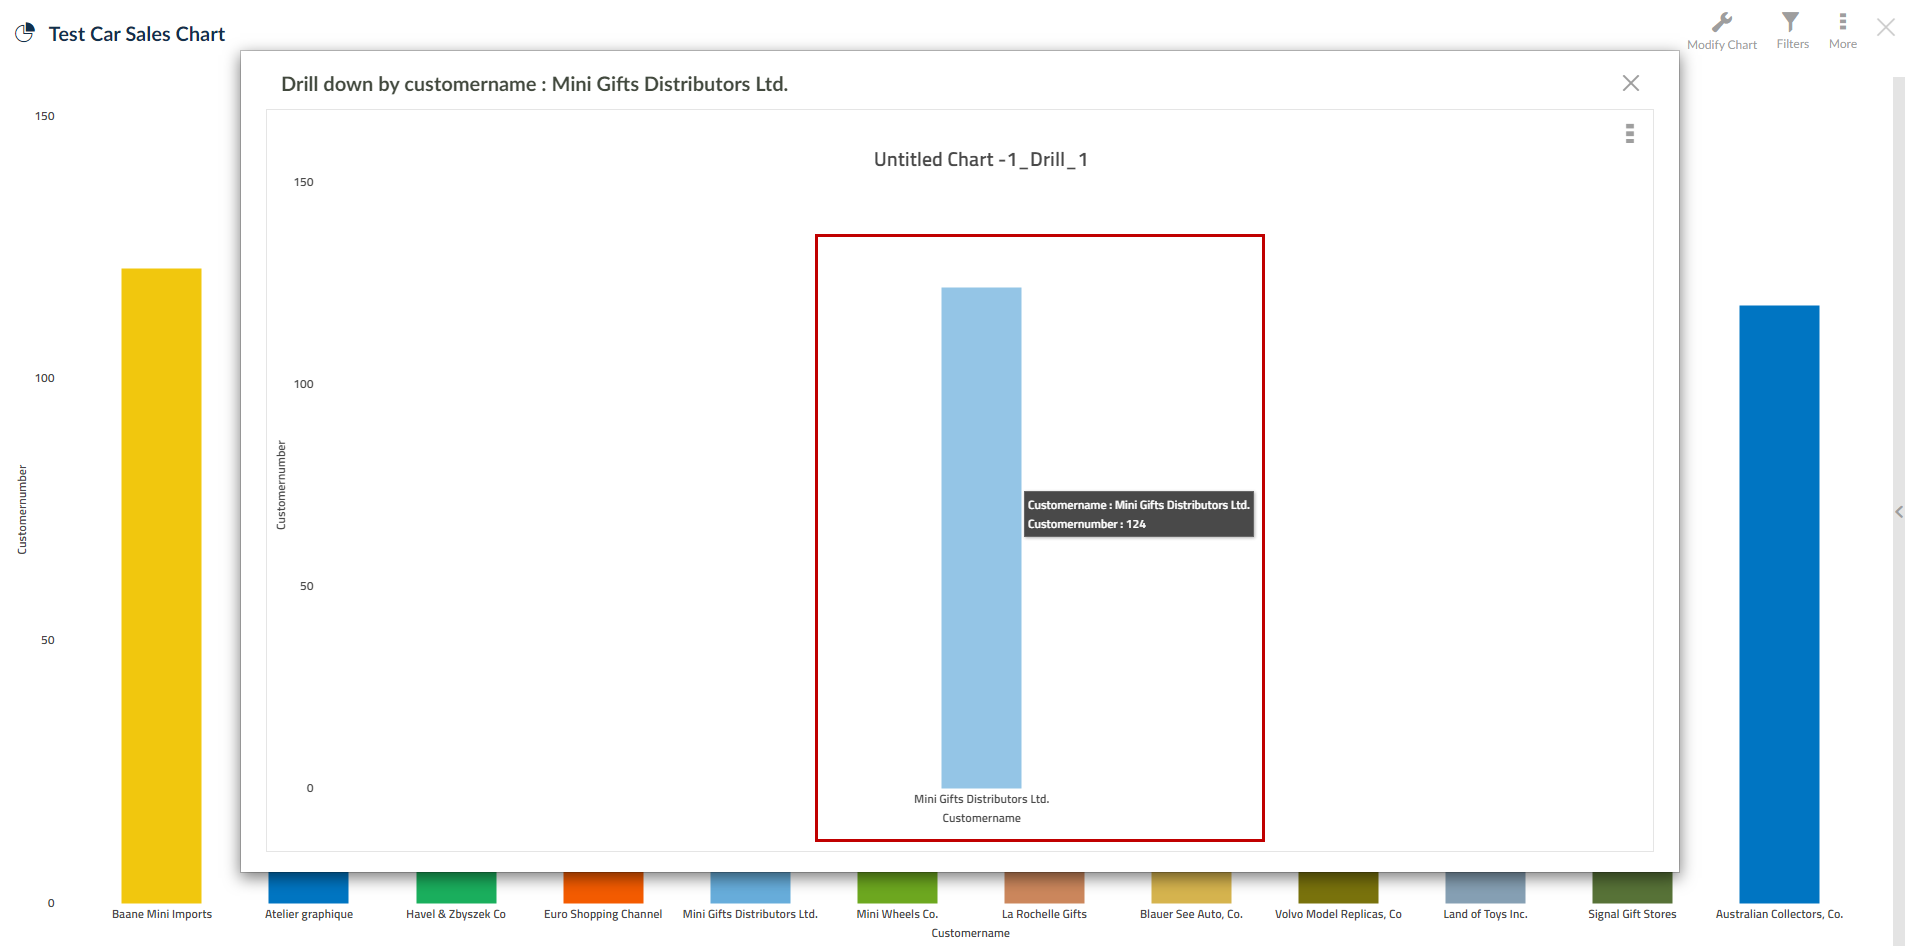
You can add custom calculation columns into the HTML report. To learn more about custom calculation columns, click here. As mentioned before, the drill down function will only become active once the chart has been installed into a dashboard. As shown in the screen shot below, by clicking on certain sections of the desired chart, you will have the HTML report opened in a new browser tab.
Click on certain sections of the desired chart, the user will have the HTML report opened in a new browser tab.

A new browser tab will appear with the populated HTML report.

SplashBI has already built into the drill-down functionality. Here is information about a few key functions:
- Instantly export the drill-down into Excel, PDF or CSV file types by clicking the icon in the top left corner. There is an icon to perform immediate distribution.
- Sort the information by selected column, determine which columns are visible and which filters are active by clicking the down arrow on the column that will base the sorting.
- At the bottom of the screen SplashBI automatically populates totals for each column, giving fast access to top end information.