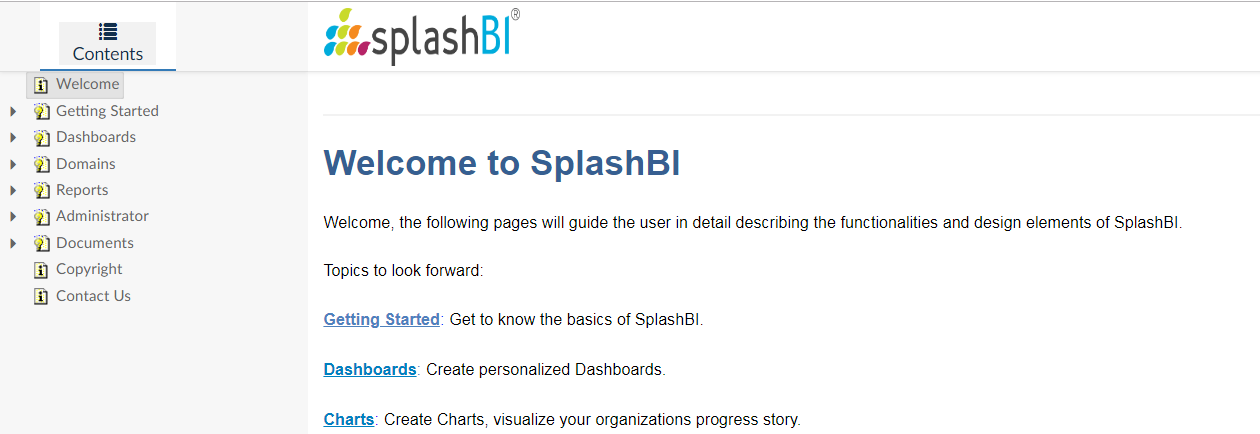
Introduction to SplashBI
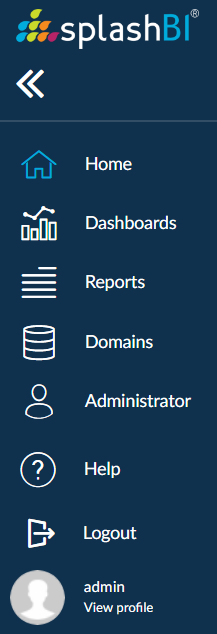
SplashBI is a versatile tool, which can connect to multiple data sources like databases, Excel spreadsheets and CSV flat files. Once connected, you can create Reports and Dashboards based on their data. The left side navigation panel has a host of navigating icons that take you to the various modules present in SplashBI. Namely,
- Home
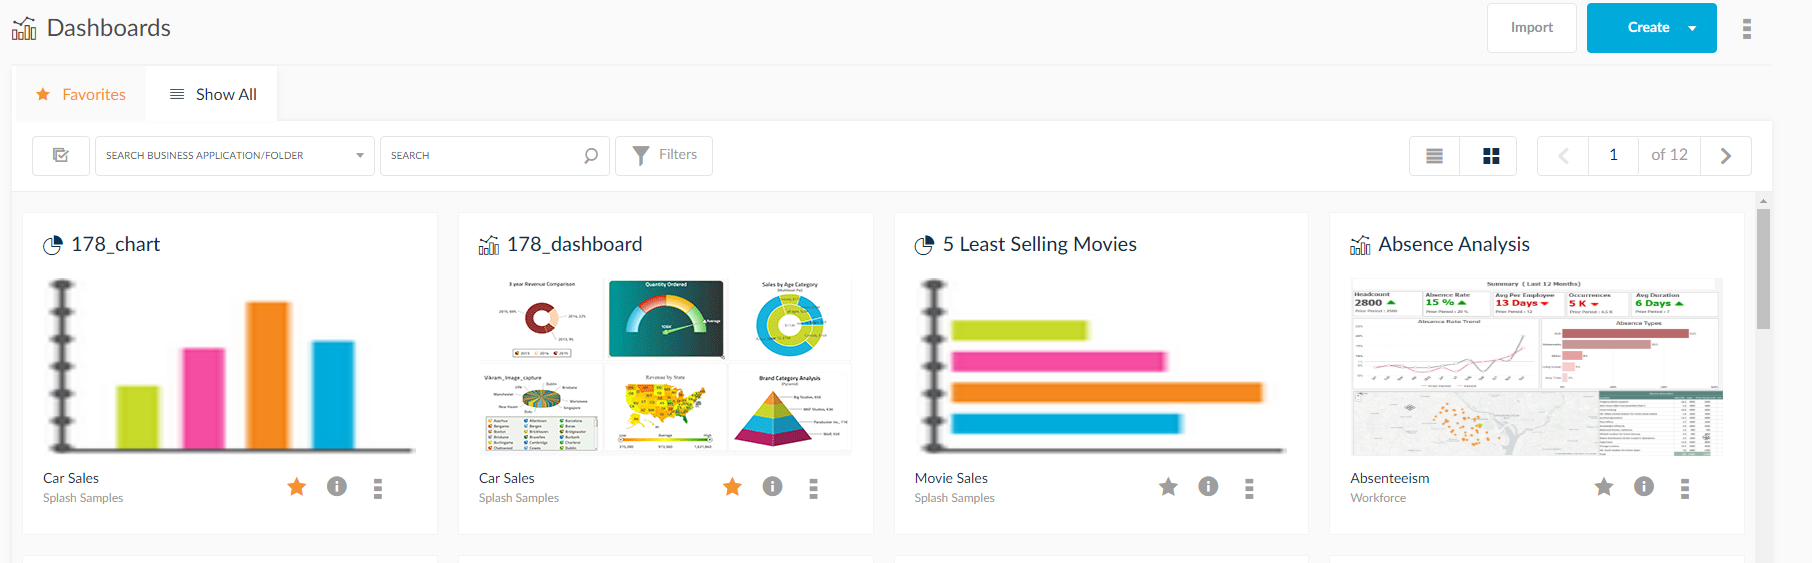
- Dashboards
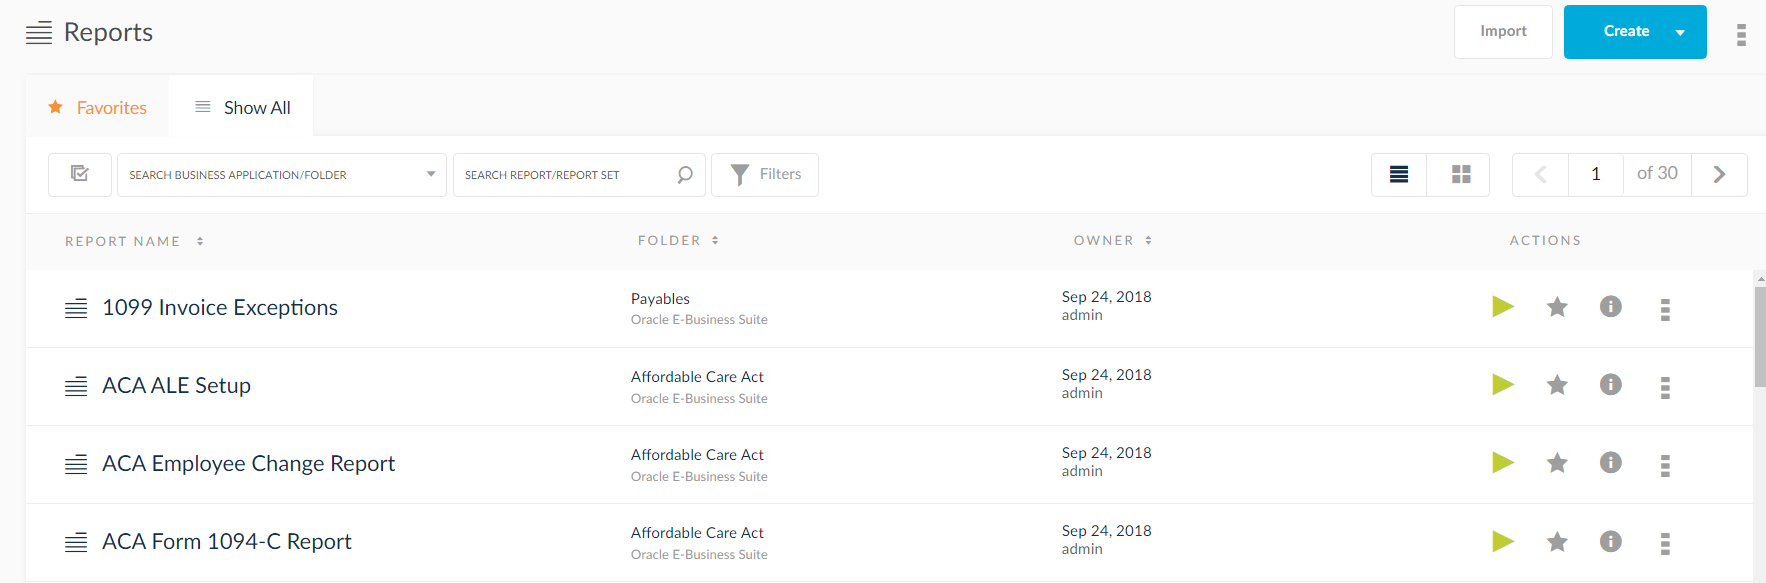
- Reports
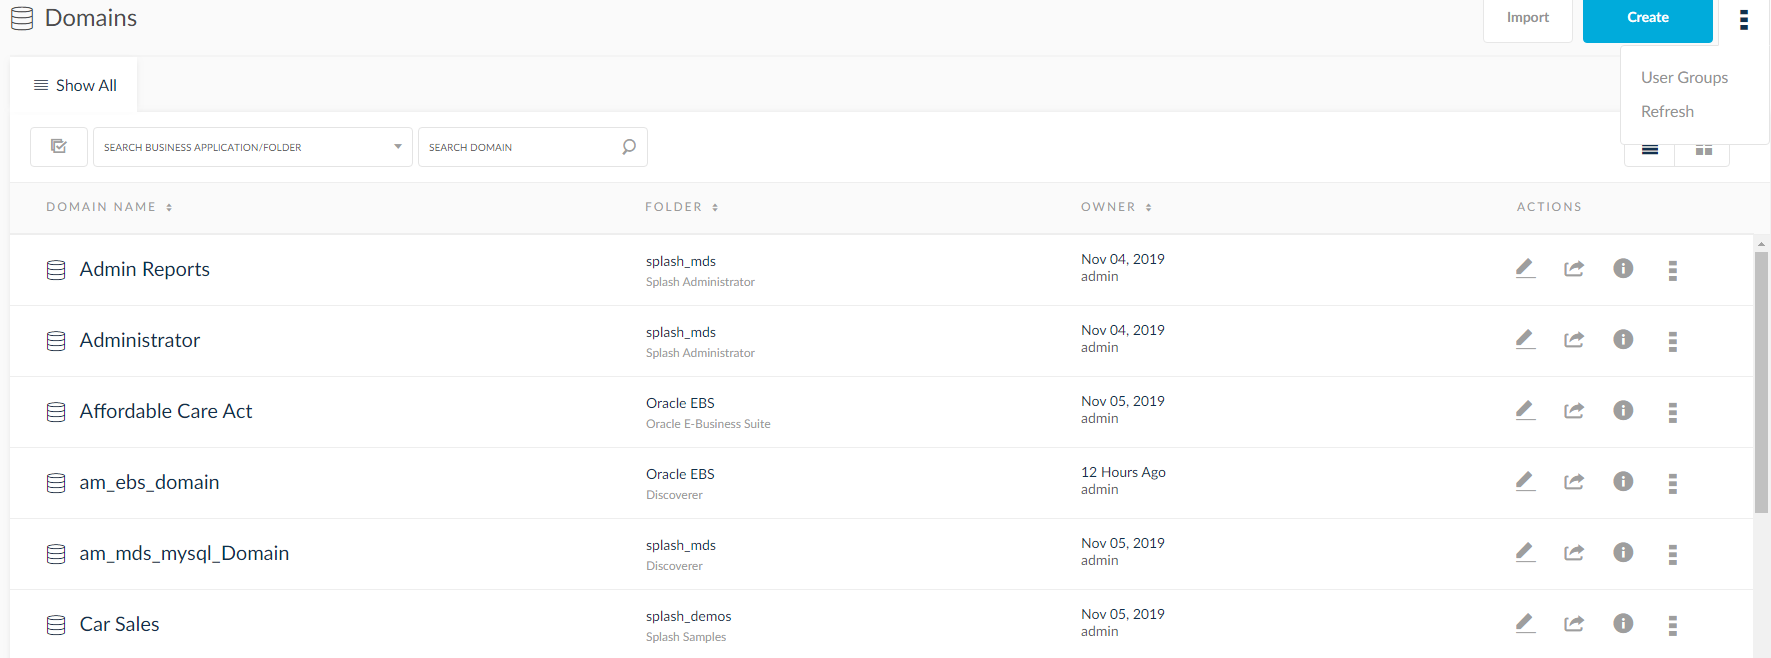
- Domains
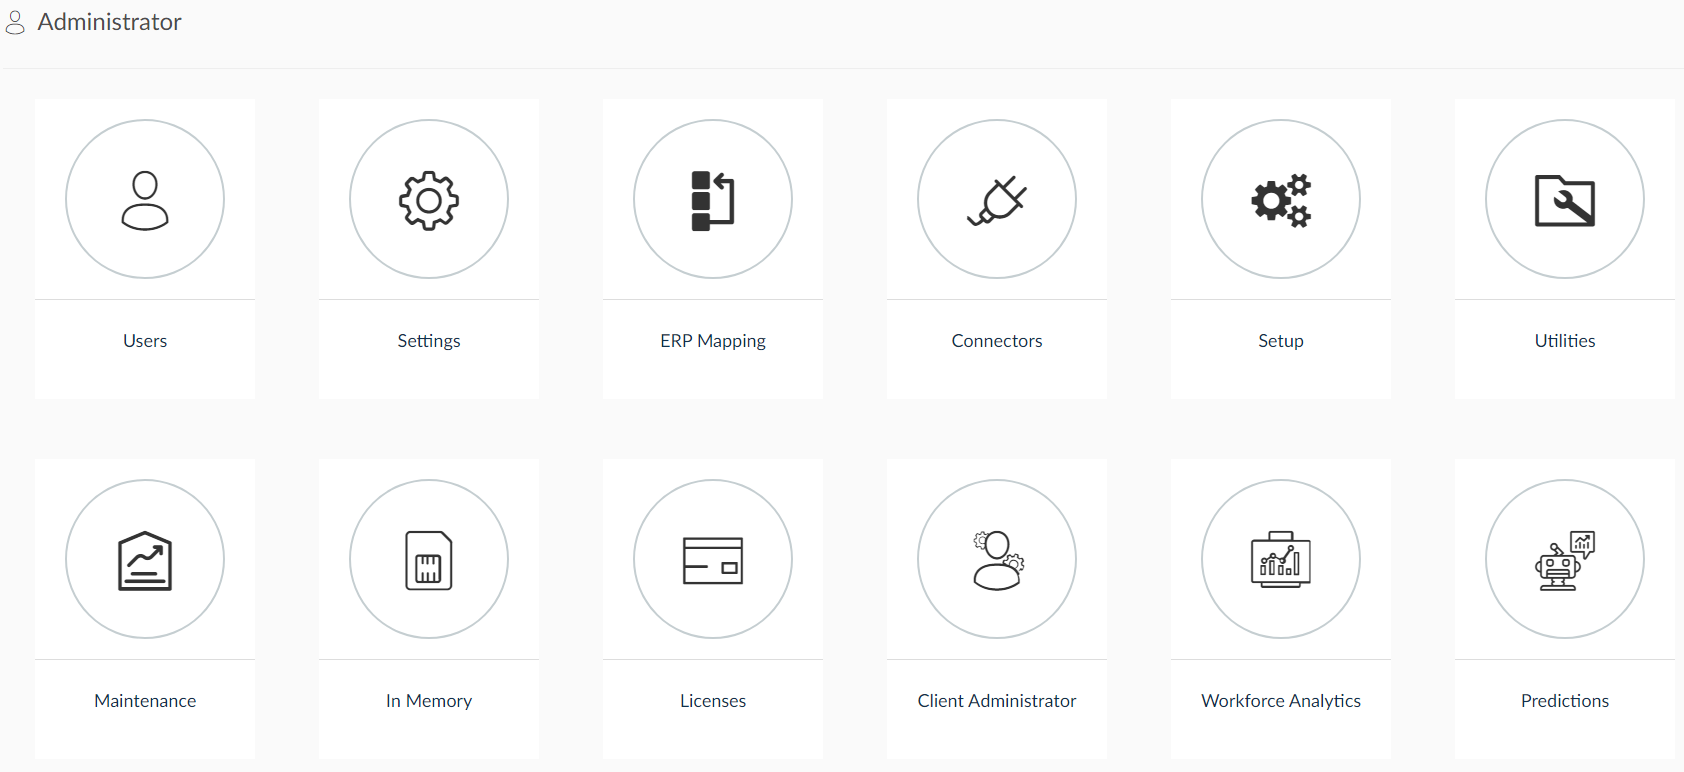
- Administrator
- Help
- Logout
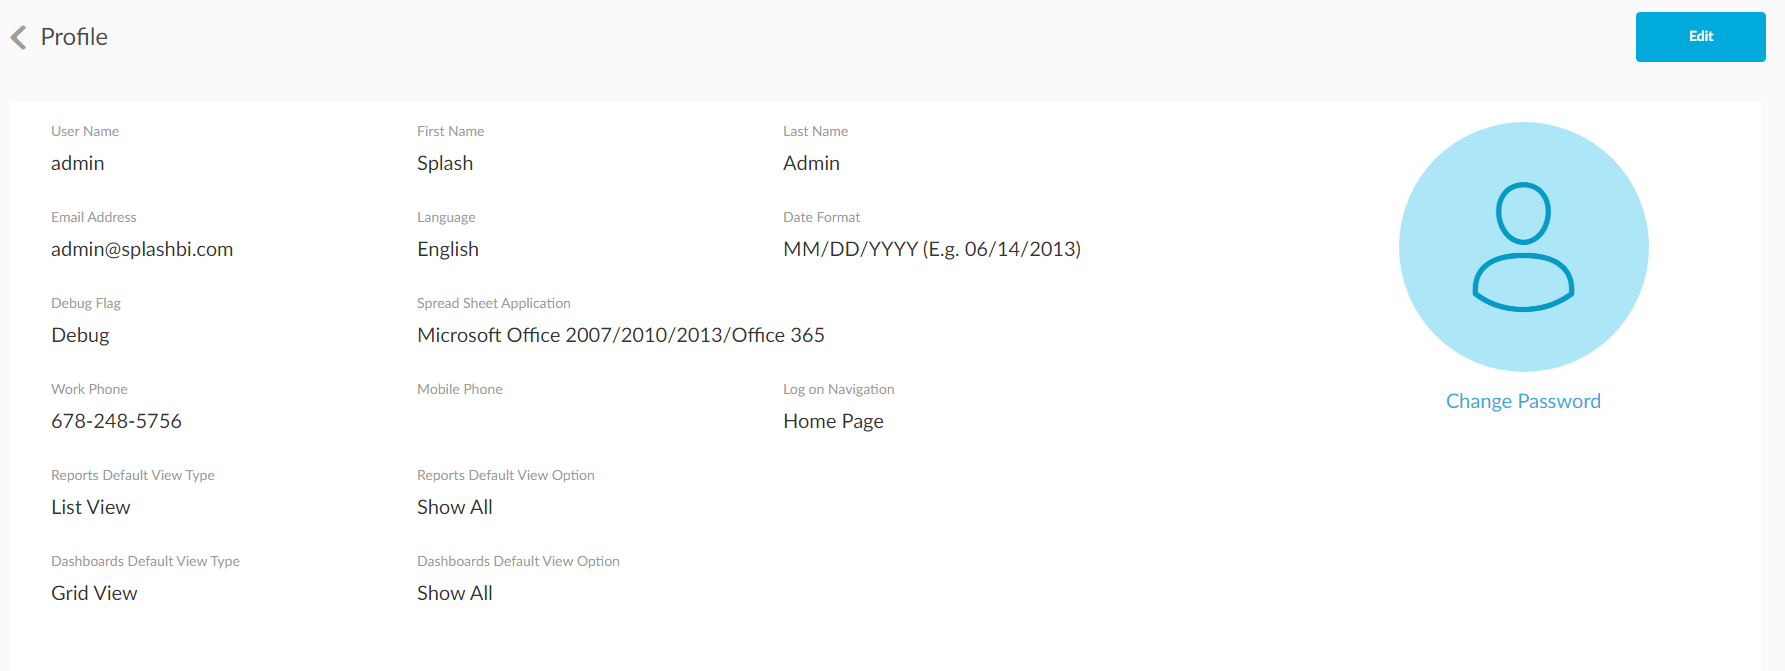
- Profile
Click on each of them to know more.
Dashboards: Here, you have access to amazing chart visualizations. You can view your data take representative shape here.
Reports: Here, you have access to created reports. You can create and edit reports from here.
Domains: Here, you have access to create/edit and view domains.
Administrator: Here, you have access to admin related functions like creating connections, editing user rights and other setup functionalities.
Help: Here, you have access to help on various functionalities of SplashBI.
View Profile: Here, you can view your profile, change password and add profile picture.